Pandemic Prompts Dash to Build Dashboards
Post Date: May 22, 2022 | Publish Date:
Among the most pressing early challenges posed by the rapidly spreading SARS-CoV-2 virus was gathering accurate data quickly enough to make a difference.
Within three months of the pandemic reaching the United States, Ben Wissel and PJ Van Camp, graduate students at Cincinnati Children’s and the University of Cincinnati, had launched “The COVID-19 Watcher,” which rapidly compiled city and county-level data on cases, deaths, and testing volumes. Judith Dexheimer was senior author of a paper about the tool that was published in the Journal of the American Medical Informatics Association (JAMIA).
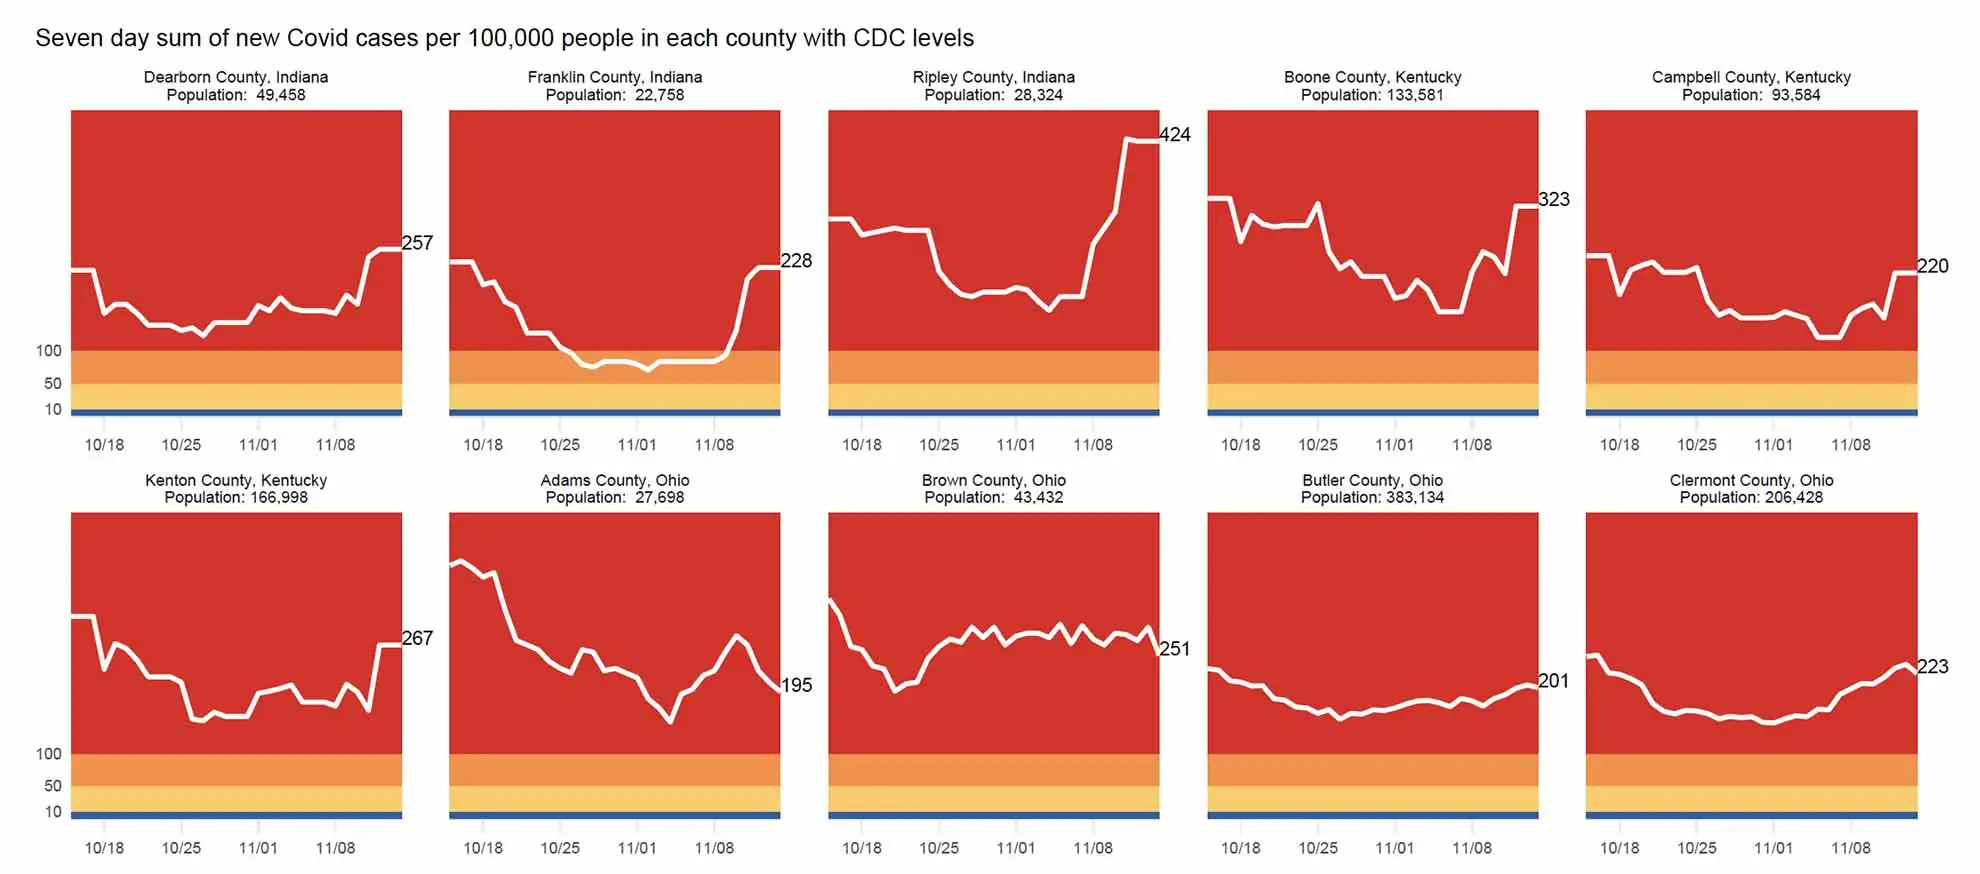
Soon, Cincinnati regional health leaders realized they needed even more granular local data about how infections were moving through the population.
Several Cincinnati Children’s experts worked in conjunction with UC’s Center for Clinical and Translational Science and Training (CCTST) to build the Health Collaborative Situational Dashboard. This dashboard, updated daily, became the definitive COVID data resource for the community. Key creators included: Stuart Taylor, MA, the data scientist who corrals the data, and project leaders Andrew Beck, MD, MPH, David Hartley, PhD, MPH, Robert Kahn, MD, MPH, and Peter Margolis, MD, PhD. (See Anderson Center story).
Meanwhile, scientists led by Jeffery Molkentin, PhD, a co-director of the Heart Institute at Cincinnati Children’s, quickly gleaned insights from more than 9,500 area residents who had donated blood to Hoxworth Blood Center during a time when interest was high in collecting convalescent plasma. The project explored who had developed antibodies against COVID-19 before vaccines were available. Findings were later published in PLOS One.
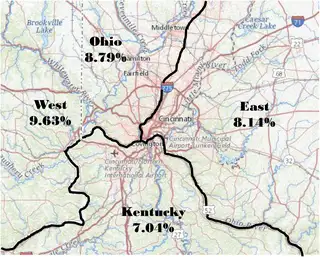
This team reported COVID prevalence nearly doubling from 7.56% in August 2020 to 13% by December 2020. The data also showed that early infection rates ran higher on the west side of the city vs. the east side and north of the Ohio River vs. south. Meanwhile, the blood tests detected a high rate of infections occurring among donors under 30 years of age that often did not result in severe illness.
Related Posts:
Cincinnati Children’s Plays Central Role in COVID-19 Vaccine Clinical Trials
Mitigating the Mental Health Burden of COVID-19
Contributing to COVID Knowledge
One Does Not Simply…Shut Down Science
Studying the Heart in the Storm
Exploring Intersections Between COVID-19 and Co-Morbidities
Balancing COVID Safety and Learning Needs
Anderson Center Team RACEs to Respond to COVID
Explore the full 2021 Research Annual Report
50+ Discoveries and Innovations (Enter Research Area, click “Featured Research”)
By-the-Numbers Section Breaks Down $270M+ in Funding
Learn About Science Careers and Student Opportunities
Find Out How You Can Support Research at Cincinnati Children’s

Latest Posts
About this blog
The Research Horizons blog features news and insights about the latest discoveries and innovations developed by the scientists of Cincinnati Children's. This blog does not provide medical advice, diagnosis, or treatment. Email researchnews@cchmc.org with questions or ideas.
Subscribe to Our Newsletter