Most Americans Were ‘Thriving’… Before the Pandemic
Research By: Carley L. Riley, MD, MPP, MHS, FAAP
Post Date: August 19, 2021 | Publish Date: Aug. 19, 2021
Please imagine a ladder with steps numbered from zero at the bottom to 10 at the top. The top of the ladder represents the best possible life for you and the bottom of the ladder represents the worst possible life for you. On which step of the ladder would you say you personally feel you stand at this time? On which step do you think you will stand about 5 years from now?
Based on how thousands of people in a national Gallup poll responded to these questions, a research team led by Carley Riley, MD, MHS, at Cincinnati Children’s set out to determine how Americans viewed how their lives were going for a decade-long period from 2008 to 2017–before the COVID-19 pandemic struck.
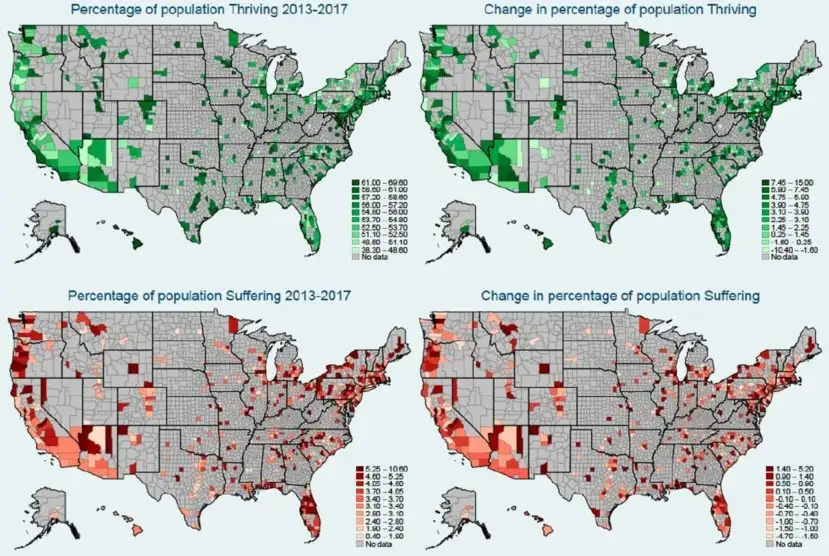
The results, published Aug. 19, 2021 in BMJ Open, showed an overall improvement in self-reported well-being among most Americans in most parts of the country. But not for all.
A closer look at the data indicates that the overall growth in the thriving category (from 48.9% in 2008 to 56.3% in 2017) primarily reflected a shift from the middle category to the top.
The percentages of people feeling themselves at the bottom of the ladder did not change in a statistically significant amount (improving slightly from 4.4% to 3.2%). And importantly at a county-by-county level, the responses showed vast gaps between where people are thriving and the suffering.
“This study uses the largest longitudinal dataset on well-being of the US population to provide the first comprehensive report on national and county-level trends in thriving, struggling, and suffering in the US,” Riley says. “While the increase in thriving is good news overall, there was still considerable room for improvement–including a more than three-fold difference in suffering between the highest and lowest performing counties.”
How is thriving measured?
The first question measures current life satisfaction (CLS) while the second measures future life optimism (FLO).
Respondents with positive views of their current life situation (CLS ≥7) and positive views of the next 5 years (FLO ≥8) were labeled as thriving. Respondents with negative views of their current life situation (CLS <4) and negative views of the future life (FLO ≤4) were labeled as suffering. Those in-between were considered to be struggling.
The goal, Riley says, was to establish a decade-long trendline at the national level from 2008 to 2017, a period that began with the Great Recession and ran to the beginning of the Trump administration, and to assess variations across smaller geographic areas over this same time period. Looking ahead, the researchers plan to examine who is and isn’t thriving now and how thriving can be fostered, especially as we navigate and eventually emerge from the COVID-19 pandemic.
Variations Evident in Greater Cincinnati
Five of the six Greater Cincinnati counties included the study reported thriving levels slightly below the national average for 2017. Meanwhile, three counties reported suffering levels that exceeded the national average.
“The variation in thriving across counties–even counties that are next to or near each other–suggests that local factors influence collective well-being. It also points to key equity gaps that require attention and action,” Riley says.
Economic, social, environmental, and political factors all play roles.
“Variation in these factors – working at different levels as determinants of wellbeing of people and places – likely underlie the observed variation in our local counties,” Riley says.
Are We Still Thriving?
While more analyses need to be completed, a recent publication from Gallup reported that during the first months of the pandemic, March through April 2020, the percentage of the US population thriving has decreased by nearly nine points since the start of 2020, from 55.3% to 46.4%, equivalent to the lowest point of the Great Recession in 2008.
In early July 2021, however, Gallup reported a considerable rebound in the percentage of Americans who are thriving, up to 59.2% in June, the highest in over 13 years of ongoing measurement.
10 counties with highest percentage thriving (2013-17)
Douglas, CO 69.6
Arlington, VA 69.5
Fayette, GA 68.3
Maui, HI 67.8
Utah, UT 67.3
Delaware, OH 67.1
Hamilton, IN 66.8
Gallatin, MT 66.4
Wright, MN 66.3
Forsyth, GA 66.3
10 counties with lowest percentage thriving (2013-17)
Navajo, AZ 38.3
Sullivan, TN 41.6
Randolph, NC 41.6
Wayne, NY 41.9
Coos, OR 42.2
Crawford, PA 42.4
Rock, WI 43
Etowah, AL 43.3
Windham, CT 43.6
Franklin, PA 44
Greater Cincinnati Regional Data (2013-17)
Warren: 60.2% Thriving, 3.4% Suffering
Butler: 55.8% Thriving, 3.1% Suffering
Boone: 55.2% Thriving, 2.2% Suffering
Hamilton: 53.7% Thriving, 2.6% Suffering
Clermont: 52.6% Thriving, 3.5% Suffering
Kenton: 48.5% Thriving, 3.6% Suffering
*These counties were not included in the study database: Clinton, Brown, Highland, Adams in Ohio; Campbell in Kentucky; and Dearborn, Ripley, Franklin counties in Indiana,
| Original title: | Trends and geographical variation in population thriving, struggling and suffering across the USA, 2008-2017: a retrospective repeated cross-sectional study |
| Published in: | BMJ Open |
| Publish date: | Aug. 19, 2021 |
Research By


Latest Posts

About this blog
The Research Horizons blog features news and insights about the latest discoveries and innovations developed by the scientists of Cincinnati Children's. This blog does not provide medical advice, diagnosis, or treatment. Email researchnews@cchmc.org with questions or ideas.
Subscribe to Our Newsletter