Interactive Dashboard Tracks COVID-19 Data by U.S. Counties, Cities, and States in Real Time
Post Date: April 27, 2020 | Publish Date:
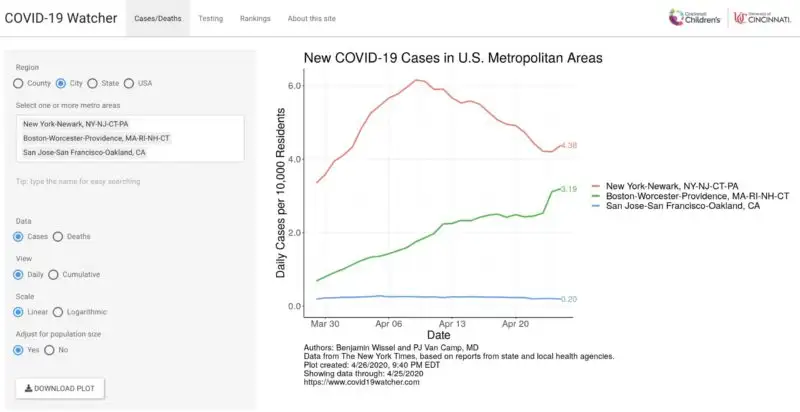
A new interactive dashboard, created in Cincinnati, provides a new way to map COVID-19 data from local to national levels.
The COVID-19 Watcher, developed by Cincinnati Children’s and University of Cincinnati graduate students Ben Wissel and PJ Van Camp, tracks cases, deaths, testing volumes, and rankings to inform people of outbreaks in their area.
Released to the public on April 1, 2020 and published in the Journal of the American Medical Informatics Association (JAMIA) on April 25, 2020, the tool has already reached thousands of users in almost every U.S. state and 18 countries.
Around the world, coronavirus outbreaks have centered on cities—Wuhan in China, Lombardy in Italy, Madrid in Spain, and London in the United Kingdom—highlighting a critical need for city-level data in the United States. Existing online tools with county, state, and national data missed this important marker.


“We started the project out of frustration for not being able to see the data as we wanted it, and it turned out many people were feeling the same way,” says Wissel, an MD-PhD candidate in the Cincinnati Medical Scientist Training Program (MSTP).
By tracking the spread of the coronavirus at the city level, the COVID-19 Watcher helps us understand how the virus is directly impacting our communities. The dashboard works by merging county-level data from The New York Times and state-level data from The Atlantic’s COVID-19 Tracking Project with sources from the U.S. Census Bureau.
Every hour, the application checks for daily updates from these sources and automatically incorporates the data in real time. Users can compare cities to watch the effects of shelter-in-place orders and gain insights on what may come next. Rankings of the worst affected areas and plots of testing capacities highlight challenges faced in different areas. This data has even prompted some users to lobby for government officials to take action in the COVID-19 pandemic.
Wissel and Van Camp, both Biomedical Informatics PhD students, have released the site code to the public. Crowdsourcing allows users to contribute their own ideas for improvements. As the pandemic evolves, the team plans to continue adding new metrics and features, such as the number of people hospitalized, demographic information, population densities, and maps.
Visit the COVID-19 Watcher site.
Read the study in the Journal of the American Medical Informatics Association (JAMIA).
Check out coverage from the University of Cincinnati


Latest Posts


About this blog
The Research Horizons blog features news and insights about the latest discoveries and innovations developed by the scientists of Cincinnati Children's. This blog does not provide medical advice, diagnosis, or treatment. Email researchnews@cchmc.org with questions or ideas.
Subscribe to Our Newsletter